Great customer journeys aren’t accidental. They’re engineered. They’re built by paying close attention to how customers interact with your brand at every stage, using real data to remove friction, and continuously improving based on what the numbers tell you.
That process has a name: customer journey optimization.
What Is Customer Journey Optimization?
Customer journey optimization (CJO) is the process of understanding and systematically improving every stage of the customer experience, from the first time someone discovers your brand to long after they’ve made a purchase.
It starts with mapping key phases: awareness, consideration, purchase, and post-purchase engagement. From there, businesses use real customer data (customer journey analytics) to identify the moments of confusion, friction, or delay that cause churn or lost revenue, and fix them.

In practice, CJO touches every customer interaction: browsing your website, reading an email, engaging on social media, using your app, or contacting customer support. Done well, it turns casual interest into purchases, first-time buyers into loyal customers, and loyal customers into advocates. It’s one of the most reliable levers for sustainable business growth.
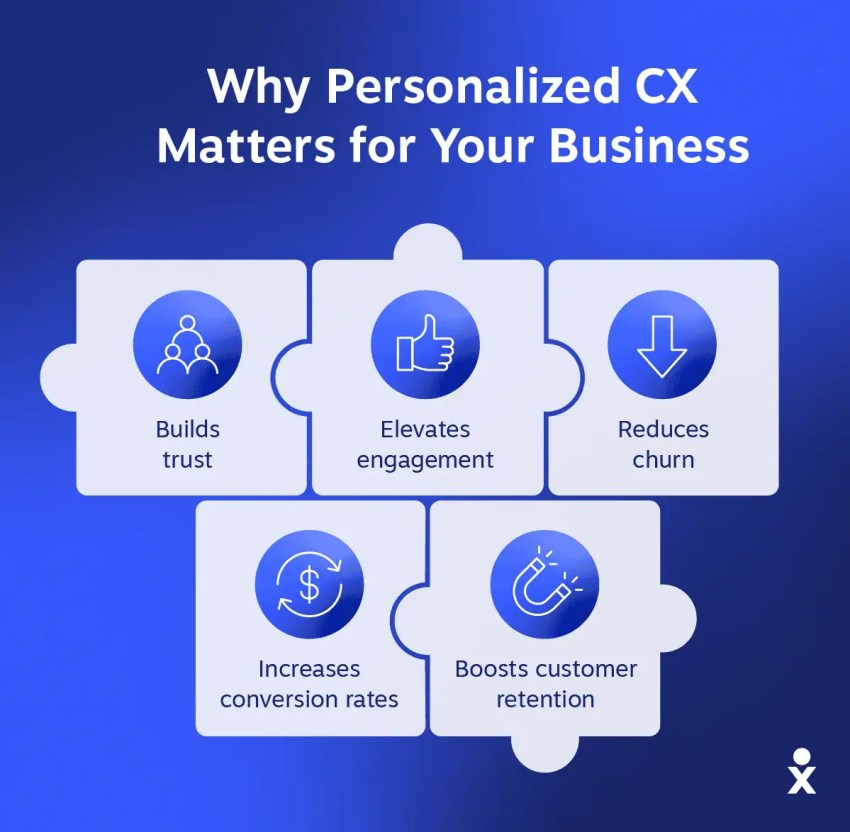
Why Customer Journey Optimization Matters (Benefits)
Optimizing the customer journey is more than a marketing tactic, it’s a measurable growth driver. Each and every customer interaction is an opportunity to build or lose trust.
Here are six business benefits that make it worth the investment.
Improve customer satisfaction
Smooth, intuitive experiences make customers feel understood and valued. According to McKinsey, well-executed customer journey optimization can improve customer satisfaction scores (CSAT) by up to 20% — a direct reflection of how well your touchpoints are working together.
Strengthen customer loyalty and reduce churn
Optimized journeys address each pain point before they lead to abandonment. As Bain & Company notes, increasing customer retention by just 5% can boost profits by 25-95%, making loyalty one of the highest-ROI outcomes of CJO.
Increase conversion rates and revenue
Guiding customers efficiently from consideration to purchase removes the friction that causes drop-off. Businesses that optimize for a seamless buying experience see continuous improvement in conversion rates and customer lifetime value (CLV), the two metrics that most directly impact top-line revenue.
Retain more customers with omnichannel consistency
Customers who experience consistent, connected interactions across channels are far less likely to leave. Businesses with strong omnichannel strategies retain an average of 89% of their customers, compared to just 33% for those with weak cross-channel experiences.
Build advocacy and reduce acquisition costs
Satisfied customers become your most cost-effective marketing channel. Nielsen reports that 92% of consumers trust recommendations from friends and family over any form of advertising. In other words, an optimized journey doesn’t just retain customers, it turns them into a source of new ones, lowering your customer acquisition cost (CAC) in the process.
Align teams around the customer
CJO creates a shared view of the customer across sales, marketing, and support, breaking down the silos that cause inconsistent experiences and missed handoffs. When every team is working from the same customer data, interactions become more coordinated, more relevant, and more effective at every stage of the journey.
Stages of the Customer Journey to Optimize
The customer journey typically unfolds across five stages, moving from first awareness to loyal customer and long-term advocacy. Understanding what customers are thinking, doing, and needing at each stage helps you create better experiences and guide them more smoothly to the next step.

Stage 1: Awareness
The journey begins when a potential customer identifies a problem or need and starts looking for answers. At this stage they may not know your brand exists; their focus is on research: searching for information, reading articles, and watching videos to understand their situation.
Your brand’s role is to be a visible and credible resource. This means creating SEO-optimized content that directly addresses their pain points, running targeted awareness campaigns on social platforms, and taking a leading role through webinars and reports to make a compelling first impression, especially since roughly 89% of customers use search for initial product research.
Stage 2: Consideration
Once customers have defined their problem, they shift into evaluation mode, which means comparing solutions, reading reviews, and reaching out to businesses for more information. This is where first impressions are tested and trust is built or lost.
Since 42% of customers (which skyrockets to 91% among 18-34 year olds) trust online reviews as much as personal recommendations, credibility is everything at this stage. Detailed product pages, comparison guides, compelling case studies, and free trials or demos all help move customers toward a decision. Retargeting ads and automated email sequences keep your brand visible as they get closer to choosing.

Stage 3: Purchase or conversion
This is the moment of decision—and the moment most businesses lose potential customers. With an average cart abandonment rate of nearly 70% for online retailers, friction at checkout is one of the most expensive problems a business can have.
Make the transaction as simple and transparent as possible. Offer a streamlined checkout experience, multiple payment options, and clear return and shipping policies. Live chat support for last-minute questions and trust signals like security badges and guarantees can be the difference between a completed purchase and an abandoned cart.

Stage 4: Retention
The sale is the beginning of the relationship, not the end of it. Since acquiring a new customer can cost five times more than retaining an existing one, what happens after the purchase has a huge impact on long-term growth.
After the purchase, the customer uses the product, tracks their order, or contacts support. Your brand’s focus must shift to delivering on your promise and investing in your business’ success.
You can achieve this through structured onboarding guides, personalized post-purchase messages, proactive and cross-channel customer service, and exclusive reward programs that encourage repeat business and strengthen customer relationships.
Stage 5: Advocacy
A satisfied customer doesn’t just keep coming back. They bring others with them. In the final stage, loyal customers become voluntary brand advocates, leaving positive reviews, recommending your product to colleagues, and sharing their experience on social media. Given that word-of-mouth influences 50% of all purchasing decisions, this stage has a compounding effect on every stage that precedes it.
So amplify it deliberately: Launch referral programs with meaningful rewards, actively collect and showcase customer reviews, and identify your most loyal customers as candidates for case studies, testimonials, and ambassador programs. The advocacy stage isn’t the end of the journey, it’s the engine that restarts it.
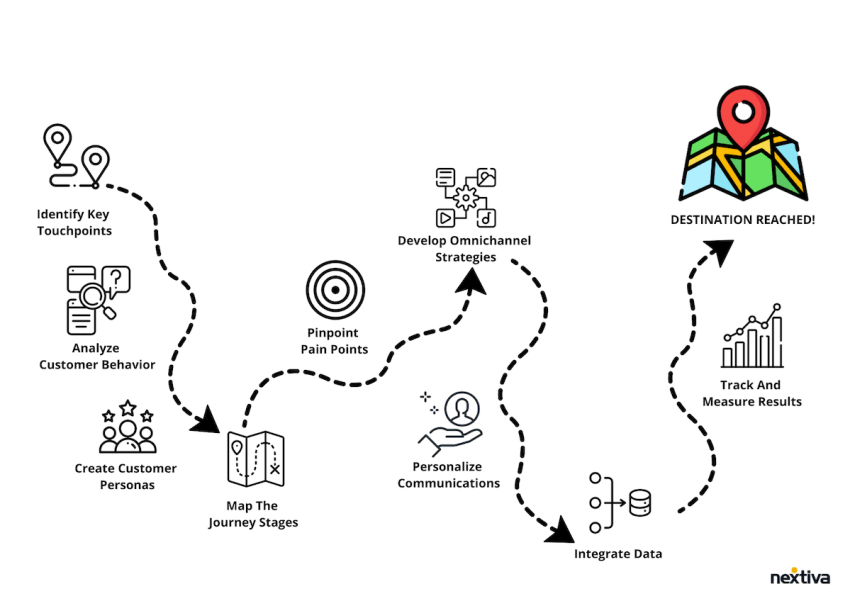
How to Optimize the Customer Journey
Customer journey optimization works best as an ongoing process, not a one-time fix. Here’s how to approach it step by step.
1. Set a clear goal
Before making changes, decide what success looks like. Start with a specific, measurable journey goal tied to a broader business objective so your work has a clear purpose and outcome.
For example, if the business goal is to increase online sales by 20%, a related journey goal might be to reduce cart abandonment from 70% to 55% within six months.
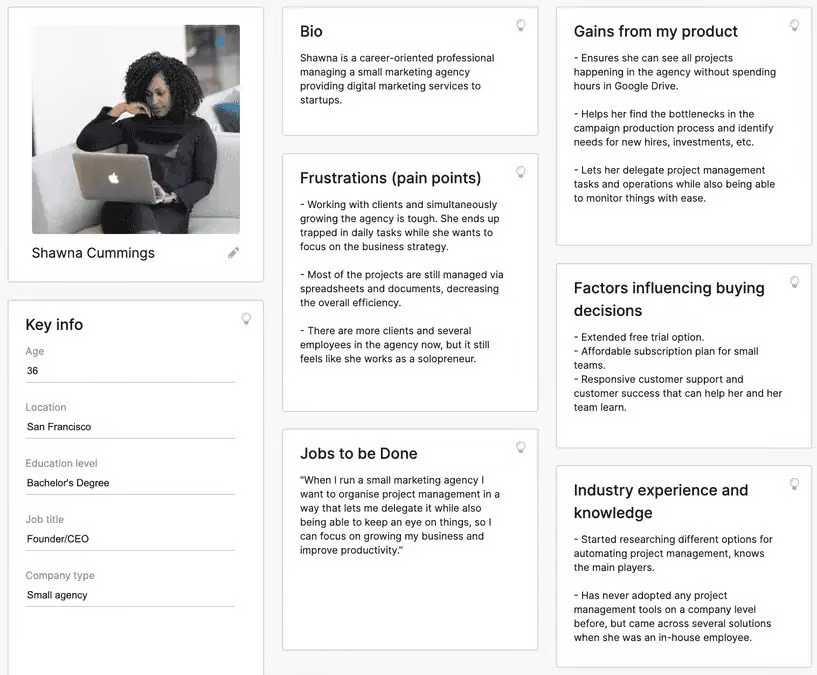
2. Define your customer personas
You cannot optimize the journey effectively if you do not know who you are designing for. Go beyond demographics. Creating customer personas helps you understand the needs, motivations, expectations, and pain points of different audience segments.
Use customer data, interviews, surveys, and market research to build personas based on real behavior, not assumptions. Strong personas help teams avoid designing for a vague “average customer” and instead create experiences that fit their highest-value segments.
3. Map the customer journey
A customer journey map shows how a customer moves from first interaction to post-purchase engagement. It helps you see the experience from the customer’s point of view and understand how different touchpoints connect across the journey.
Map each stage alongside the channels, actions, and touchpoints involved. For example, awareness may begin with a social media ad or search result, consideration may involve a product page or demo, and retention may depend on onboarding emails or customer support.
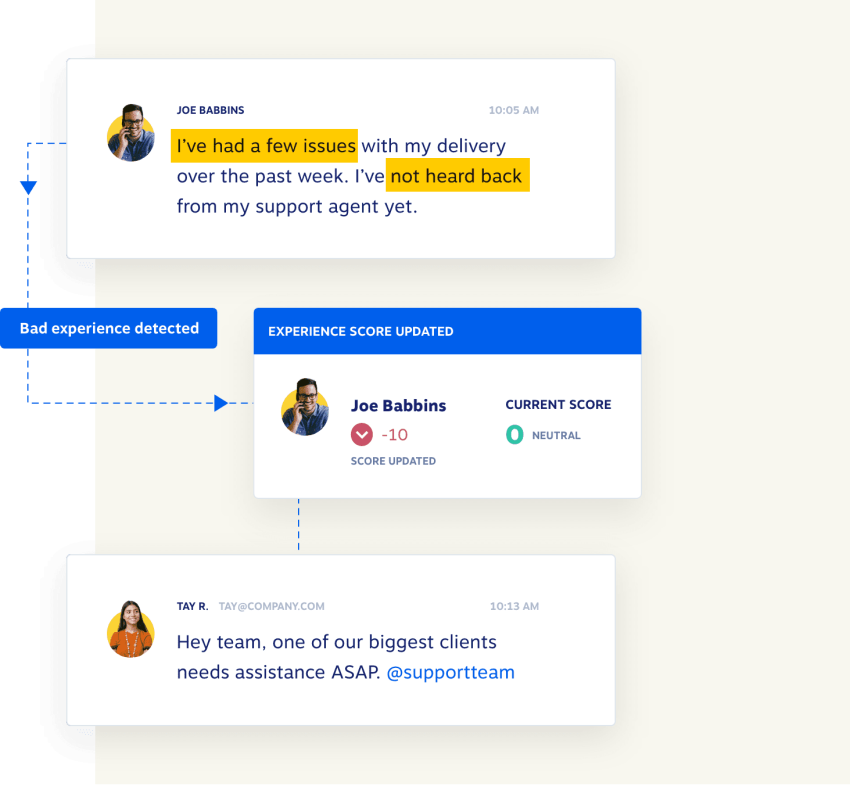
4. Identify friction points with data
Once the journey is mapped, use data to find where customers are struggling or dropping off. This step is about finding where customers are struggling—before they tell you, or leaving without telling you at all. Quantitative metrics show where friction exists, while behavioral data helps reveal how it happens.
Look for friction points and signals such as high bounce rates, low conversion rates, abandoned forms or carts, repeated support contacts, or low product adoption. Tools like web analytics, funnel reports, heatmaps, and session recordings can help pinpoint problem areas. It is also useful to walk through the journey yourself to catch obvious issues that raw metrics may miss.

5. Gather customer feedback
Customer journey analytics can tell you where problems happen, but customer feedback helps explain why. Surveys, interviews, reviews, and support interactions can reveal frustrations, unmet expectations, and moments of confusion that data alone cannot capture.
Ask for feedback at key points in the journey, such as after a purchase, onboarding experience, or support interaction. Keep questions short and specific so the responses are easier to act on.
6. Implement and test changes
This is where valuable insight turn into action. Use what you learn to prioritize improvements and test them deliberately. Instead of making broad changes based on instinct, build a clear hypothesis and measure the result.
For example, if customers frequently abandon checkout after seeing shipping costs, you might test whether showing a “Free shipping on orders over $100” banner earlier in the journey reduces drop-off. A/B testing can help confirm whether the change improves performance.
7. Personalize the customer experience across channels
As customers move between channels, the journey should feel consistent and relevant. Personalization helps businesses deliver better recommendations and messaging, while cross-channel coordination prevents the experience from feeling fragmented.
Start by segmenting your audience so communications are more relevant to each group. From there, use customer data to support tactics such as personalized recommendations, triggered follow-up messages, and support interactions that reflect a customer’s history with your brand. The goal is to create a smoother experience across the full journey, not just optimize isolated touchpoints.
Customer Journey Optimization Best Practices
The seven-step process above tells you how to optimize. These best practices tell you how to think about optimization—the operating principles that determine whether your efforts stick or stall.
Break down silos
Customers don’t experience departments, they experience a brand. When marketing, sales, and support operate in isolation, the gaps between them become visible to customers as inconsistency, repeated questions, and dropped context.
Eliminating silos starts with giving every team access to the same customer data. A unified communications platform creates a single source of truth, so whether a customer last spoke to a sales rep or filed a support ticket, every team member has the full picture before the next interaction begins.
Deliver a consistent omnichannel experience
Your customers interact with your brand across your website, social media, email, and phone, often switching between channels mid-journey. Each channel may be managed by a different team, but the customer experiences it as one continuous relationship.
Businesses with a strong omnichannel strategy experience a 9.5% annual revenue growth (compared to 3.4% for those without). A unified contact center platform allows customers to move from live chat to a follow-up call without losing context or repeating themselves. Customers who feel heard at every touchpoint are far less likely to leave.

Make support easy to access
Customers shouldn’t have to hunt for help, especially when they’re already frustrated. Accessible, responsive support is one of the highest-impact variables in journey satisfaction.
Offer the right channel for each type of need: live chat for quick questions, email for detailed inquiries, phone for complex issues. Surface these options clearly at the moments in the journey where customers are most likely to need them, not buried in a footer.
Remember: A minor issue that goes unaddressed becomes a churn risk, whereas the same issue resolved quickly becomes a loyalty moment.
Continuously update your customer journey map
Customer expectations, technologies, and market trends change. Your customer journey map isn’t a static document, but a living one. Schedule regular reviews—at least quarterly or semi-annually—to analyze team performance, incorporate customer feedback, and adapt to new behaviors. This iterative process aligns your customer experience strategy with your customers’ actual wants and needs and allows you to improve.
Key Metrics for Customer Journey Optimization Success
Optimization without measurement is just guesswork. These six key metrics give you a clear, quantifiable picture of whether your customer journey changes are working.
Conversion rate
Conversion rate measures the percentage of customers who complete a desired action—a purchase, a sign-up, a demo request—at a specific stage of the journey. It’s the most direct indicator of whether your optimization efforts are removing friction and moving customers forward.
Track conversion rate at each stage individually, not just at the final purchase. A low conversion rate early in the journey (awareness to consideration) points to a different problem than a low rate at checkout. Stage-level conversion data tells you exactly where customers are falling off, and where to focus your next round of improvements.
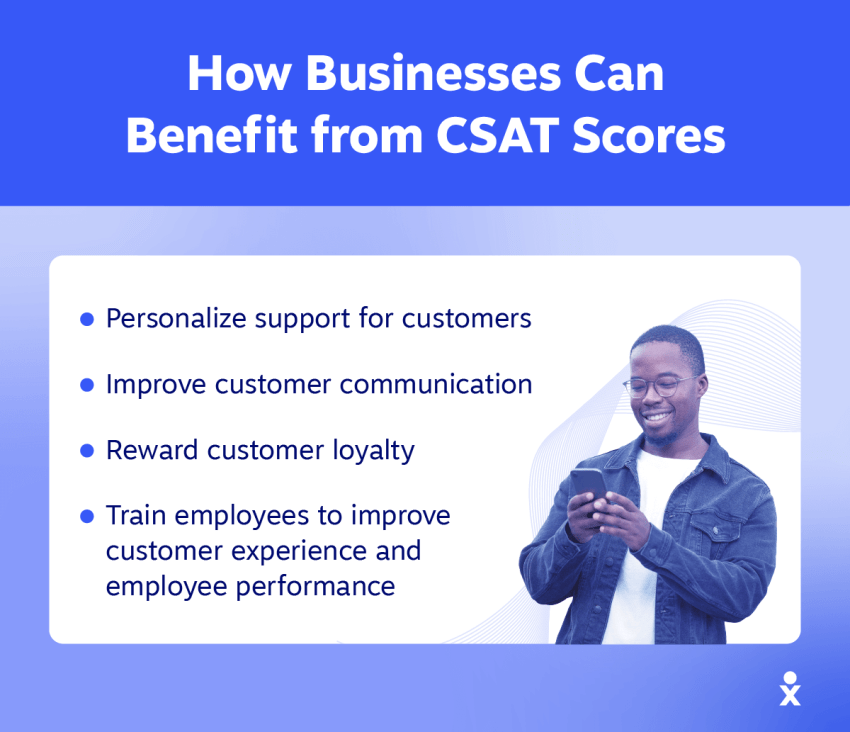
Customer Satisfaction Score (CSAT)
CSAT measures how satisfied customers are with a specific interaction, such as a support call, a purchase experience, or an onboarding session. It’s typically collected immediately after the interaction via a simple survey: “How satisfied were you with your experience today?”
CSAT is most valuable as a touchpoint-level metric rather than an overall score. A high overall CSAT can mask a terrible support experience if the purchase experience is excellent. Measuring CSAT at individual touchpoints shows you which interactions are building trust and which are quietly eroding it.
Net Promoter Score (NPS)
NPS measures customer loyalty by asking: “How likely are you to recommend us to a friend or colleague?” Respondents are scored on a scale of 0–10 and categorized as Promoters (9–10), Passives (7–8), or Detractors (0–6). Your NPS is the percentage of Promoters minus the percentage of Detractors.

Where CSAT measures satisfaction with a moment, NPS measures the overall health of the relationship. A rising NPS signals that your optimization efforts are compounding: customers aren’t just satisfied with individual interactions, they’re becoming advocates. A falling NPS is an early warning sign that something in the journey is undermining long-term loyalty, even if short-term satisfaction scores look fine.
Customer Effort Score (CES)
CES measures how easy it was for a customer to complete an action, like resolve an issue, find information, or make a purchase. It basically asks: “How easy was it to handle your request today?” on a scale from Very Difficult to Very Easy.
CES is one of the most underused but predictive metrics in journey optimization. Research from Gartner shows that high-effort experiences are one of the strongest predictors of disloyalty/churn; customers who struggle are 96% more likely to leave than those who find the experience easy. If your CSAT scores are acceptable but churn remains high, a low CES is often the culprit.
Retention rate and churn
Retention rate measures the percentage of customers who continue doing business with you over a given period; churn is the percentage who leave. Together they’re the clearest long-term signal of whether your optimized journey is delivering on its promise after the sale.
Since acquiring a new customer costs five times more than retaining an existing one (as mentioned above in “Stage 4: Retention”), even small improvements have a big impact on revenue. Track retention and churn by customer segment, acquisition channel, and product line, not just as a single overall number. Segment-level data reveals which customer groups your journey is serving well and which it’s losing, giving you a precise target for your next optimization cycle.
Drop-off points across the journey
Drop-off rate measures where customers exit the journey without completing the next step: which page they leave, which step they abandon, which interaction they don’t return from. It’s less a single metric than a diagnostic lens applied across every stage.
High drop-off at a specific touchpoint is one of the most actionable signals in journey optimization because it tells you exactly where to look. Pair drop-off data with session recordings and heatmaps to understand the behavior behind the exit, whether it’s a confusing UI, an unexpected cost, a slow page load, or a support gap. Reducing drop-off at even one high-traffic stage of the journey can have a compounding effect on every conversion metric downstream.
Tracking all six metrics together gives you a complete picture: conversion rate and drop-off tell you what’s happening, CSAT and CES tell you how customers feel about it, and NPS and retention tell you whether your optimization efforts are building the kind of loyalty that drives sustainable growth.
Common Customer Journey Optimization Challenges
Even well-resourced teams run into the same obstacles when optimizing the customer journey. Knowing what to watch for makes them easier to address before they stall your efforts:
❌ Siloed data and teams. When marketing, sales, and support operate on separate systems, the customer pays the price through inconsistent handoffs and disconnected experiences. CJO requires shared ownership of the customer experience across every team, backed by a unified platform that gives everyone access to the same data in real time.
❌ Inconsistent customer experiences. A seamless website experience means nothing if the follow-up email is generic or the support interaction feels like a different company. Consistency across channels requires documented standards, shared tools, and regular audits of how the journey actually feels end-to-end.
❌ Limited visibility into friction points. You can’t fix what you can’t see. Full journey visibility requires layering multiple data sources—web analytics, session recordings, support ticket themes, and drop-off data—because the friction points that matter most are rarely captured by any single tool.
❌ Failing to act on feedback. Collecting customer feedback without acting on it is worse than not collecting it at all. Build a clear workflow for reviewing findings, assigning owners, and closing the loop so feedback translates into action rather than a spreadsheet no one reads.
With the right tools, it’s easy to understand customer behavior, improve engagement, and optimize your customer journey. A mix of the following technologies provides a clearer picture of your customers and enables better optimization.
Analytics tools
They’re your eyes and ears, helping you track customer behavior, website traffic, and conversion data. Customer analytics tools enable you to identify drop-off points, spot trends, and make data-driven decisions.
Examples: Nextiva, Google Analytics, Mixpanel, Hotjar

CRM software
Customer relationship management (CRM) software stores customer data and tracks interactions across all channels. They help personalize communications and manage relationships throughout the customer lifecycle.
Examples: Salesforce, HubSpot CRM, Zoho CRM
User experience (UX) tools
UX tools provide insights into how customers interact with digital platforms. They highlight usability issues and help you optimize interfaces for better navigation, increased customer engagement, and greater satisfaction.
Examples: Crazy Egg, FullStory, Adobe XD
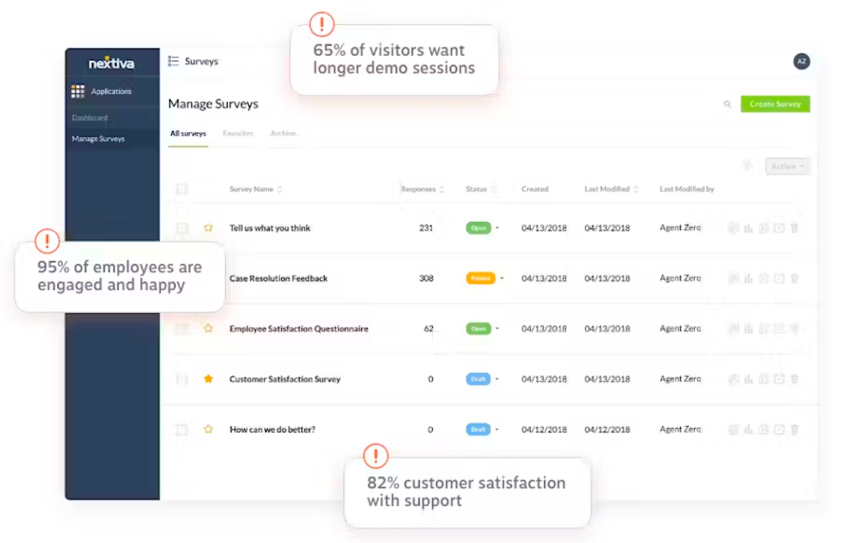
Survey and feedback tools
Survey tools let you easily understand your customers’ needs, preferences, and frustrations, helping you identify pain points and areas for improvement.
Examples: SurveyMonkey, Typeform, Qualtrics
Contact center software
Contact center software supports customer service by optimizing communication via phone, chat, and email. Advanced contact center providers offer AI capabilities too to automate repetitive tasks, monitor service quality, and offer timely support.
Examples: Nextiva, Zendesk, Five9

Optimize Your Customer Journey with Nextiva
A great customer experience doesn’t happen by accident. It happens as a result of understanding every stage of the journey, removing friction at each step, and continuously improving based on what your customers tell you.
Optimization is an ongoing commitment, not a one-time project. The brands that win long-term are the ones that put the customer at the center of every decision, and build the tools and processes to back that up.
Nextiva makes that easier. With AI-powered workflows, unified customer communications, and real-time journey tracking, Nextiva gives every team the context they need to deliver an intelligent, personalized experience at all customer touchpoints, from the first interaction to the last.
Orchestrate your customer’s journey.
AI-powered journey intelligence, built in. Track every interaction, predict what’s next, and deliver seamless experiences.
Customer Journey Optimization FAQs
Customer journey mapping is like drawing a detailed route. It visually depicts every step a customer takes in their interaction with your brand, from the initial touchpoint to post-purchase. Customer journey optimization, on the other hand, is about refining that route. Using the journey map, you identify pain points, close gaps, improve the experience, and align each touchpoint with customer expectations.
Review and update your journey map at least once or twice a year. However, you should review it again sooner if there are bigger changes, such as the launch of new products or services, the adoption of new technologies (like a new CRM or support platform), or if you notice shifts in customer behavior or market trends.
Track a mix of qualitative and quantitative metrics, including customer satisfaction scores (CSAT), Net Promoter Score (NPS), conversion rates, abandonment points, retention rates, and the Customer Effort Score (CES).
Common missteps include focusing too much on internal goals rather than customer needs, ignoring feedback, making assumptions without data, and treating the journey as a one-time project rather than an ongoing process.