In the third quarter of 2024, the EU economy greenhouse gas emissions were estimated at 767 million tonnes of CO2-equivalents (CO2-eq), a 0.6% decrease compared with the same quarter of 2023 (772 million tonnes of CO2-eq). The EU’s gross domestic product (GDP) registered a 1.3% increase in the third quarter of 2024, compared with the same quarter of 2023.
This information comes from data on quarterly estimates for greenhouse gas emissions by economic activity published by Eurostat today. Quarterly estimates of greenhouse gas emissions complement quarterly socio-economic data, such as GDP or employment.
This article presents the key findings from the more detailed Statistics Explained article on quarterly greenhouse gas emissions.

Source datasets: env_ac_aigg_q and namq_10_gdp
The economic sectors responsible for the largest reductions between the quarters were electricity and gas supply (-6.7%) and transportation and storage (-0.9%).
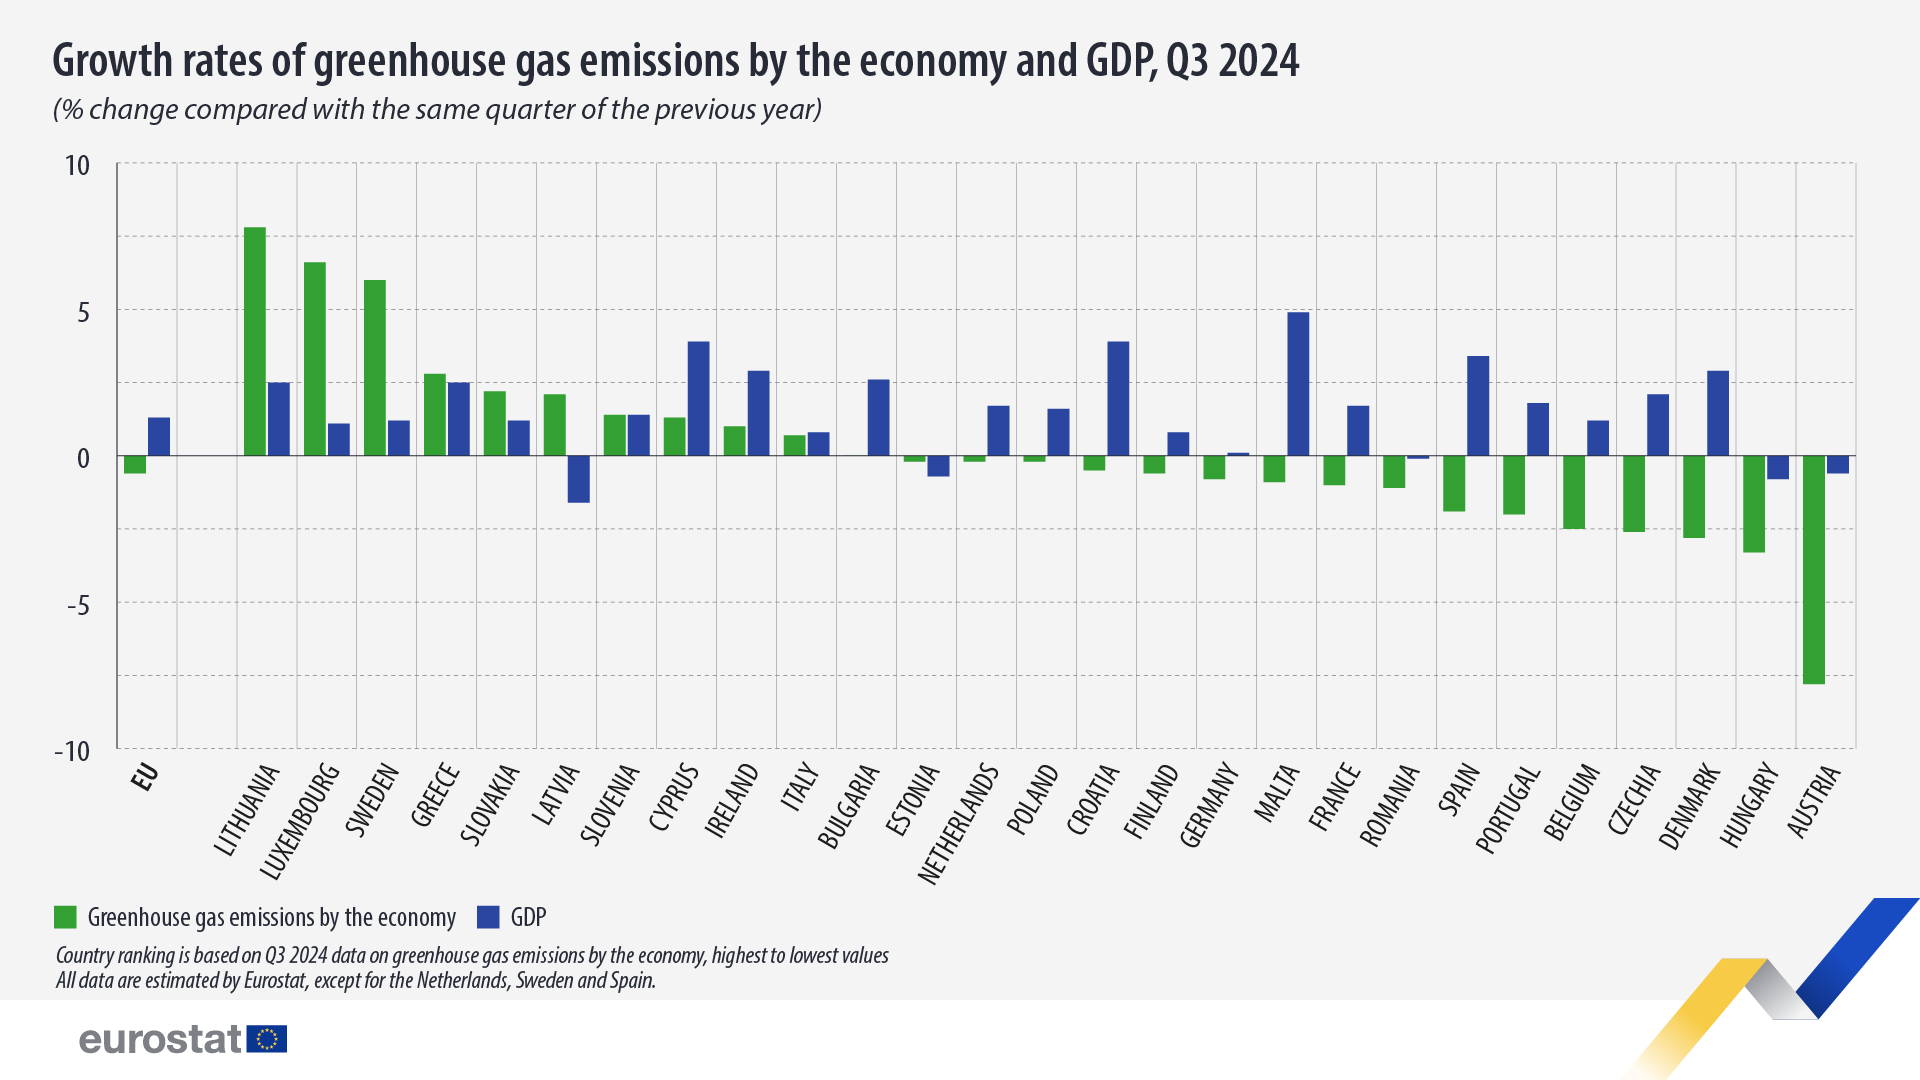
Greenhouse gas emissions down in 16 EU countries
In the third quarter of 2024, a decrease in greenhouse gas emissions was estimated in 16 EU countries when compared with the same quarter of 2023.
The largest reductions in greenhouse gases were estimated for Austria (-7.8%), Hungary (-3.3%) and Denmark (-2.8%).
Out of those 16 EU countries, 4 recorded a decline in their GDP (Hungary, Austria, Estonia and Romania). The other 12 EU countries (Malta, Croatia, Spain, Denmark, Czechia, Portugal, France, the Netherlands, Poland, Belgium, Finland and Germany) were estimated to have decreased emissions while growing their GDP.
Source datasets: env_ac_aigg_q and namq_10_gdp
For more information
- Statistics Explained article on quarterly greenhouse gas emissions
- Thematic section on climate change
- Database on climate change
- Environmental accounts dashboard
Methodological notes
- Metadata on quarterly greenhouse gas emissions.
- The figures in this news item are non-seasonally adjusted. Progress is measured against the same quarter in the previous year, to avoid the interference of seasonal effects.
- The data presented here are estimates by Eurostat, except for the Netherlands, Sweden and Spain, which provided their own estimates. Eurostat’s methodology differs from the United Nations’ (UN) rules, particularly in attributing international transport emissions to individual countries. Eurostat estimates include these emissions in each country’s total, following the international System of Environmental-Economic Accounting (SEEA) standard.
- As parties to the UNFCCC and the Paris Agreement, the EU and the EU countries report annually on their greenhouse gas emissions to the UN. The so-called ‘Kyoto basket’ of greenhouse gases includes carbon dioxide (CO2), methane (CH4), nitrous oxide (N2O) and fluorinated gases. They are expressed in a common unit, CO2-equivalents. EU countries are required to monitor their emissions of these gases for all source sectors based on internationally agreed obligations and rules. The EU greenhouse gas inventory managed by the European Environment Agency covers emissions from 1990 to 2 years before the current year and is submitted to the UN each spring after quality checks. According to the European Climate Law, the EU’s climate target is to achieve a -55% net reduction by 2030 and climate neutrality by 2050.